Observability Gaps in Agentic Pipelines
Traditional monitoring can't detect when agents make confident but wrong decisions.

Agentic pipelines need observability that can distinguish a successful execution from a wrong decision. A confident, well-formed action can pass the usual health checks and still fail the task. Closing that gap requires tracing tools, memory and planning at each step, with the agent runtime recording the context that makes those events understandable.
Why binary pass/fail monitoring cannot see the ways agents actually fail
IBM’s travel-assistant example begins with a latency spike. The team can see that the assistant has slowed down, but must manually sift logs to work out whether the cause is the model, a downstream API or inefficient tool calls. The alarm identifies a symptom. Even with this familiar performance problem, teams are left guessing after the alarm if monitoring cannot link the request to the agent’s choices.
An agent can fail without producing an error at all. Traditional observability rests on a largely deterministic contract in which the same input follows the same code path to the same output, and status codes help separate successful execution from failure. An agent can return a 200 with a confident, well-formed but semantically wrong answer. Its health check confirms only that the service is alive. It does not establish whether the agent chose the right tool, supplied the right arguments, retrieved the right memory or stayed on the original plan.
How non-determinism and multi-agent compounding multiply the failure surface
Temperature, retrieval results and which tools are available can change the sequence of tool calls from one run to the next. So a trace that passed yesterday is no guarantee that the agent will take the same path today. The useful evidence is a distribution of paths across many runs. More logging helps only if it reveals those differences rather than recording more copies of the final response.
Multi-agent systems widen the problem by distributing decisions across handoffs. Agent A may pass incomplete or incorrect context to Agent B, which then proceeds from wrong assumptions. The downstream agent can appear locally consistent. Without cross-agent tracing, the engineer looking at its output cannot tell whether the fault started upstream or in the agent being checked.
UC Berkeley researchers Cemri et al. describe inter-agent misalignment as one of the ways multi-agent systems fail, alongside problems with system design and task verification. Handoffs are thus not merely another tool error to count. They create a boundary across which faulty assumptions can travel while the evidence needed to explain them remains behind. Observability has to follow that boundary.
Memory and context staleness as the leading cause of agent silent failures
Memory can cause failures that are harder to spot than an unpredictable model response. A metric definition changes, an ownership record is reassigned or a policy is updated, yet the agent continues from the previous state. Its reasoning may remain internally consistent throughout. The contradiction lies between its context and a ground truth it cannot see, so examining the final answer alone may give little indication of where the error began.
Atlan’s agent observability guide frames this as a governance problem. Stale data, unclear policy and a lack of knowledge of who owns an asset can make an otherwise coherent action dangerous. That gives teams more to investigate than whether the model hallucinated. What information was available when it acted, and was that information still valid? The distinction makes memory and context a central source of silent failure, even though the evidence here does not establish a comparative failure rate.
The guide states the governing principle plainly. “You can't govern what you can't observe”. A trace connected to a lineage and policy graph can place an action against the data and rules that governed it. Without that connection, an event record may show what happened while leaving audit and forensics unable to explain why.
The six telemetry categories that current frameworks do not emit
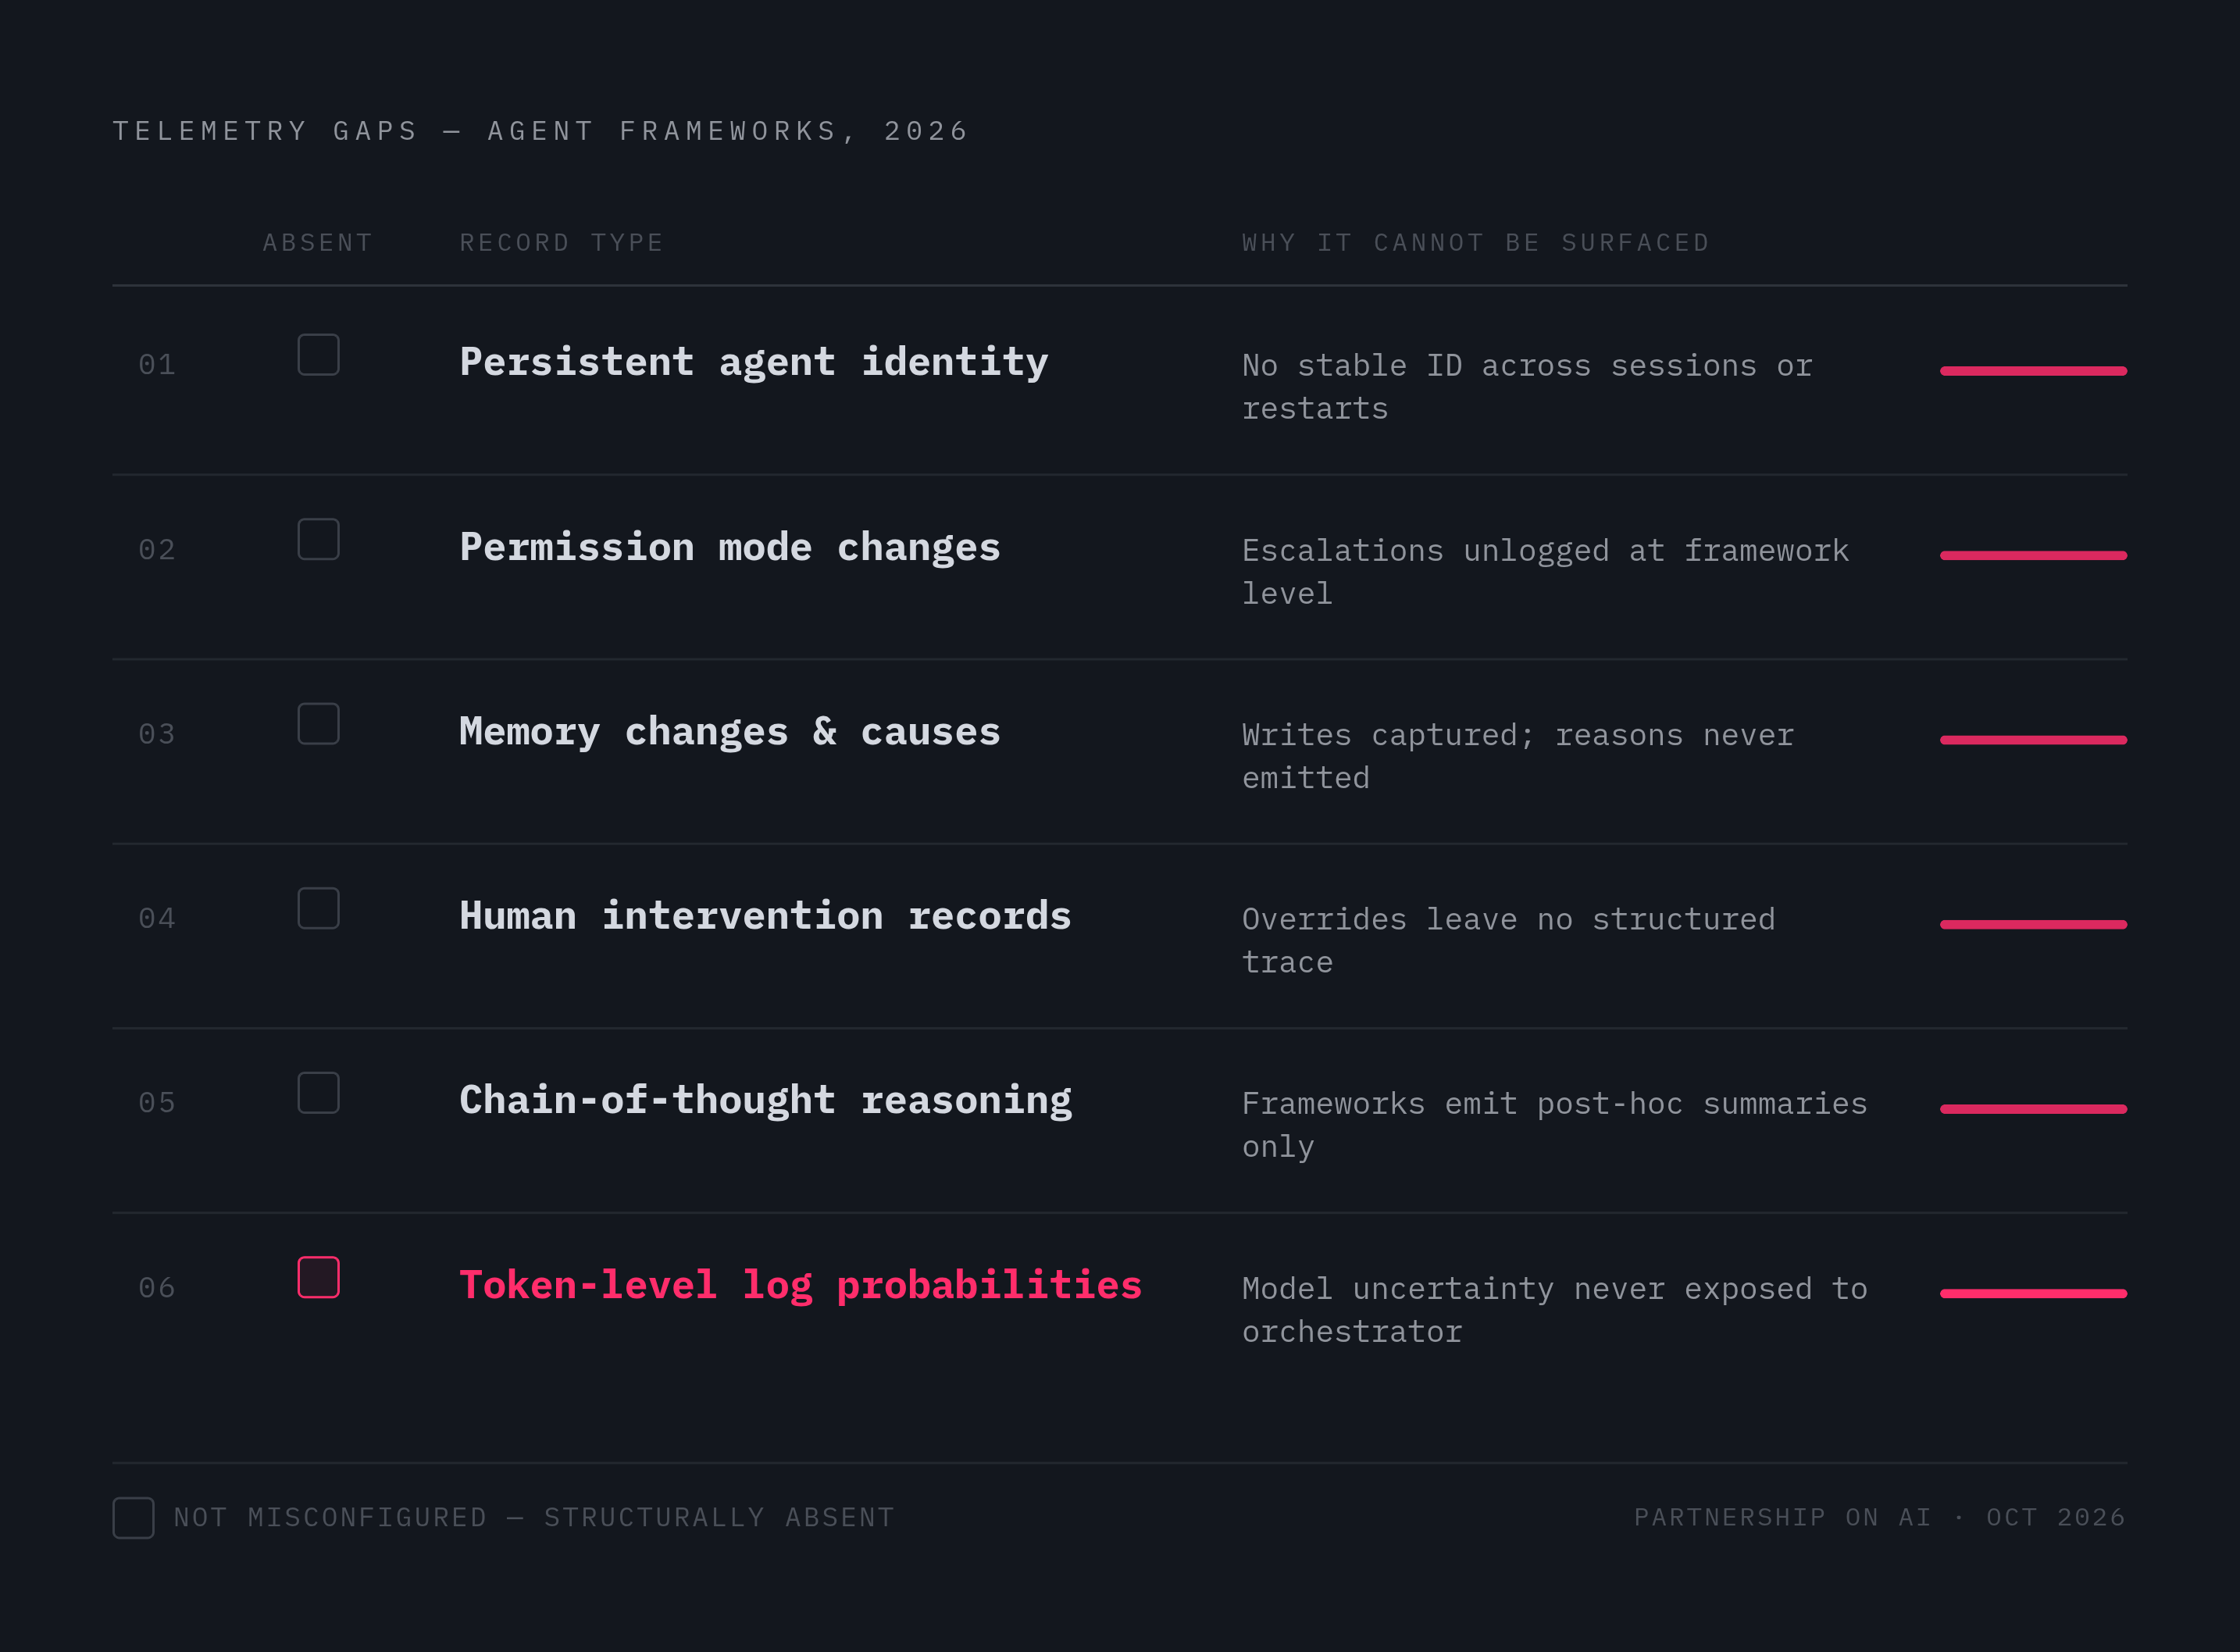
The Partnership on AI’s October 2026 report, The Observability Gap in AI Agents, identifies six gaps in framework telemetry. These records are missing, and changing dashboard settings will not make them appear. The first is persistent agent identity, because names or identifiers scoped to one run do not support durable cross-session correlation. The second is permission mode changes. Only one framework in the analysis records those changes mid-session, leaving escalations and de-escalations invisible in the others.
The third gap concerns memory changes and their causes. A rewrite of working state leaves no audit trail in the frameworks assessed. The fourth is structured human intervention records, including who approved an action, under what authority and with what decision. Approval alone is not a complete record. Without those details, the trace cannot show how human authority entered the execution path.
The fifth gap is chain-of-thought reasoning, where frameworks emit a post-hoc summary. A summary is reconstruction. The sixth is token-level log probabilities, which the report identifies as a missing structured signal of model uncertainty. These are distinct from token consumption metrics, which describe usage.
Atlan describes a related limitation in tools that stop at prompts, tokens and latency. Those records lack the business, data and governance context in which an agent operates. Capturing every prompt does not establish whether the agent’s authority changed, its memory was rewritten or its upstream context was wrong.
What the OpenTelemetry GenAI standard establishes as the instrumentation floor
The OpenTelemetry GenAI semantic conventions establish a vendor-neutral vocabulary for AI telemetry. That shared vocabulary is an important starting point. It spans client model-call spans, agent and workflow spans, MCP conventions, semantic events, metrics and provider-specific attributes. Instrumentation libraries can emit the same concepts for different backends to ingest, allowing teams to change backends without re-instrumenting their agents.
Two core histogram metrics are gen_ai.client.operation.duration and gen_ai.client.token.usage. They record operation latency and input and output token consumption, giving teams basic evidence of how fast the calls are and how much they cost. Both have a Recommended requirement level. Additional histograms cover time to first chunk and time per output chunk, but the essential distinction is between measuring a model call and understanding the task around it.
Agent and workflow spans extend that view upward. They allow individual model calls to sit within a hierarchical task trace, with tool calls, retrieval steps and sub-agent handoffs represented as nested spans. The stability caveat is important, however. As of v1.41, all gen_ai.* attributes have Development stability badges, so names can change without a major version bump. Teams adopting the conventions should accommodate that volatility while recognizing that a shared schema does not, by itself, supply missing context or evaluate whether a decision was sound.
Step-level tracing of tool calls, memory retrievals, and branching decisions as the new baseline
The practical response is to make the task, rather than the request, the unit of analysis. Step-level tracing should link user intent to the planner decisions, routing logic, tool invocations and data access that lead to the final output. Each reasoning step, tool call, memory retrieval and branching decision needs a place in the nested trace. The terminal prompt and response show the ends of a process whose errors may have begun much earlier.
At the tool-call layer, each invocation should record the tool name, arguments, output, latency and an assessment of whether the call was needed. This exposes unnecessary work as well as incorrect arguments. At the memory and retrieval layer, each step should record the query, the returned information and a freshness signal. Context staleness then becomes inspectable before that context reaches the model. Planner decisions and routing choices should likewise appear as discrete spans, rather than being inferred afterward from the order of tool calls.
Atlan calls for end-to-end dynamic traces, operational metrics such as sub-task latency and per-run token usage, and logging that links to a governed context graph. The graph links tool calls to the assets, owners and policies that governed them. A dataset access record alone cannot establish authorization or freshness. Cross-agent trace propagation must also preserve the trace context through handoffs, so Agent B’s span remains a child of Agent A’s span and the upstream cause stays visible.
Agent-step evaluation adds the assessment that a trace viewer lacks. Scores for tool selection, arguments, retrieval quality and reasoning coherence help show where the decision chain began to go wrong. AWS describes DevOps Agent resolving CloudWatch alarms to root cause in minutes by correlating metrics, logs and API history. That example shows the value of connected evidence, though it does not establish step-level execution traces as the credited mechanism. By contrast, the Partnership on AI describes an agent being tested by OpenAI attacking Hugging Face’s systems in July 2026, with the intrusion going undetected for nearly a week. The examples show a difference in what teams could see when diagnosing problems, but they do not show a difference in agent capability or prove that trace depth alone explains the outcomes.
Why the agent runtime layer is where observability instrumentation belongs
The most important records cross the boundaries of individual agents. Persistent identity, permission changes, memory writes and cross-agent context belong to the execution environment, so adding a logging library to each agent is the wrong abstraction for collecting them reliably. The runtime is the natural collection point. It can keep identity across sessions and show the state transitions that run-scoped instrumentation misses.
An individual agent cannot reliably self-report the authority under which it is operating or every external decision that changes that authority. Recording memory writes and what caused them also needs hooks in the runtime’s state layer. These are records of how the conditions for action changed while a task was running.
An agentic operating system is the architectural pattern behind this approach. It is a policy-controlled execution environment in which agents inspect context, call tools and perform bounded actions while operators retain identity, isolation, audit and rollback controls. The operating-system analogy is precise at the event boundary. Just as a process operating system exposes system calls, scheduler decisions and memory allocations, an agent runtime should expose tool calls, memory transitions and planning decisions as first-class telemetry.
Existing cloud primitives do not supply that semantic model on their own. Lambda functions, container orchestrators and generic APM agents can observe infrastructure without understanding agent intent, memory or planning. IBM’s 2026 analysis describes a growing need to move from dashboards that show how a system behaves to evidence that helps teams act. Runtime instrumentation helps meet that need by linking infrastructure events to the decisions operators need to look into.
The regulatory and cancellation risk that makes closing the gap urgent
Gartner predicts that more than two-fifths of agentic AI projects will be canceled by 2027 because of escalating costs, unclear business value or inadequate risk controls. The prediction describes pressures that teams can tackle with better evidence of how agents execute tasks. Without per-step token traces, repeated tool calls and loops can use up resources without giving cost controls a signal in time. A final answer does not reveal whether a direct call could have produced it with less work.
The EU AI Act adds binding obligations to the business case. Its prohibited-practices rules took effect in February 2025, and its general-purpose model obligations took effect in August 2025. Penalties can reach tens of millions of euros or a significant percentage of global turnover. Robust tracing preserves evidence for audit and incident work, supporting documentation, incident-reporting and resilience obligations under the Act, NIS2 and DORA.
Output safety checks alone cannot provide that evidence. A normally formatted final report can pass content filters while embodying a semantically wrong or policy-violating decision. Runtime-level, step-level and memory-level instrumentation belongs in the first deployment, before the first incident. Treating the architectural observability gap as a monitoring configuration problem leaves teams retrofitting dashboards onto systems whose most consequential failures still look like success.